Ever wondered whether you are using the right gain or exposure when deep sky imaging? Whether 6x ten minute exposures really do give you more detail than 12x five minute exposures? No more guesswork required with the new SharpCap Pro Smart Histogram feature. In combination with the results of Sensor Analysis (see below), SharpCap can measure the sky background brightness for you and then perform a mathematical simulation of the impact on final stacked image quality of using different gain and exposure combinations. You can also see graphs showing the impact of using longer or shorter exposures (or lower or higher gain) than suggested.
If you try this using a modern, low noise, CMOS sensor you might be pleasantly surprised to find out that the optimal exposure length isn’t nearly as long as you imagine and that maybe the complexities of guiding will become a thing of the past (The use of long – 5 to 10 minute or even longer – exposures in traditional deep sky imaging is not required to see faint targets, it’s actually required to deal with the high typical read noise of CCD sensors. Since the optimal exposure length is proportional to the square of the read noise and CMOS read noises can be 1-3 electrons instead of 8-10, exposures can often be much shorter with no loss of quality).
The basic form of Smart Histogram takes the form of a pair of coloured bars along the top of the histogram area :
The top bar with the red, amber and green sections shows the impact of your camera’s read noise on the total image noise at that brightness level. For areas of the image in the red highlighted region of the histogram, the camera read noise dominates the total noise (>50% of total noise). In the amber region, the read noise contributes significantly to the total noise (10% to 50%). In the green region, the contribution from read noise is small (<10%). The size of the red and orange zones will vary as you vary the gain and offset controls of your camera. Once you have picked values for those controls, you should adjust the exposure so that the histogram peak corresponding to the sky background is just to the right of the orange zone – this will give you optimum image quality without entering the zone where increased exposure time has diminishing (to zero) returns.The lower bar indicates the effect of bit depth on the quality of captured image. In high bit depth modes (12, 14, 16 bit), the bar is green and light green – the light green section shows the range where the increased bit depth is not helping you because the total pixel noise equals or exceeds the distance between ADU levels in 8 bit mode. In the light green region, the use of high bit depth simply means that you are recording the pixel noise in greater detail!
In 8 bit modes, the lower bar is amber and green :
The amber region indicates the part of the histogram where you are throwing away data by using 8 bit mode (ie you would get more image quality by switching to 12/14/16 bits for parts of the image in this histogram region). The amber region will shrink to the left as you increase the camera gain level, and at the high gains used in planetary imaging it may not be visible at all – this shows why there is no need to use high bit depth modes for planetary ‘lucky’ imaging (and also that the Smart Histogram isn’t only useful for deep sky!).
The coloured bars at the top of the histogram are just the ‘quick’ way to use the Smart Histogram features, giving you some basic guidance on exposure times and bit depths. For a more in-depth calculation that gives recommendations on gain, offset, exposure and bit depth, press the ‘Brain’ button next to the coloured bars to bring up the Brain window.
The ‘Brain’ window is quite complicated, but if you follow it from top to bottom it should not be too hard to use.
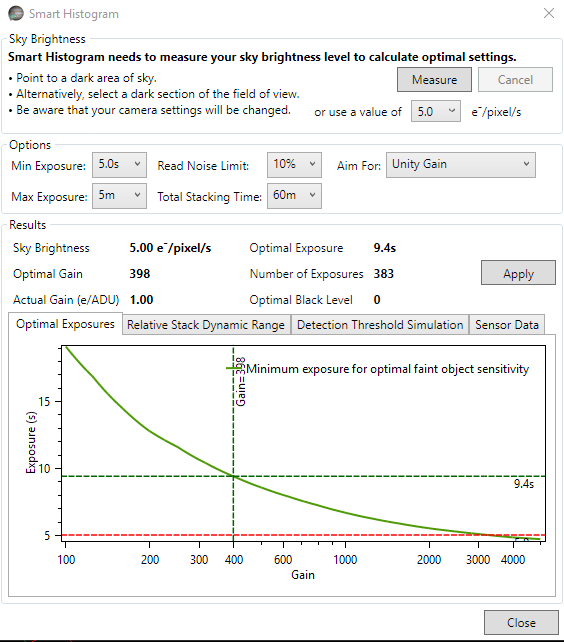
The goal of the Brain is to help you pick the right camera settings to get the best deep sky images. Note that the Brain is *not* aiming to give you fabulous quality sub-exposure images, it is calculating how to get the best final image when you stack all frames taken in a set period of time (1 hour by default). The calculations will work out for you whether it is better to take 360 x 10 second images or 10 x 360 second images or some other combination.
The first step is to measure (or enter) your sky brightness – this is measured in electrons per pixel per second and is a measure of how much signal is arriving at every pixel on your camera every second from sources that we don’t really want – light pollution and thermal noise being the main culprits. If you press the ‘Measure’ button then SharpCap will set the gain to maximum and take a number of increasing length exposures to measure this value – you should point the telescope at an area of sky without nebulosity or many stars to get a good measurement.
The next step is to set limits and targets for the calculation – you can set a minimum and maximum exposure to consider (typically maximum exposure is determined by mount tracking/guiding quality and minimum by how much data you have to save with very short frames or stacking speed for live stacking). You can also set the time you intend to image for (not critical, changing this will *not* change the suggested values) and the contribution you are prepared to tolerate from the sensor read noise in the final image noise level. If you select a ‘Read Noise Limit’ of 10%, that means that the calculations will allow the total noise level in the final stacked image to increase by 10% above the minimum achievable noise level (ie to go from 10 to 11 on some scale).
The last choice in this section determines how the gain is chosen – the two options are ‘Unity Gain’ which aims for 1 electron per ADU (or as close as possible) and ‘Max Dynamic Range’. ‘Max Dynamic Range’ finds the gain where the final stacked image will have the maximum ratio between the brightest thing that is not quite saturated and the noise level. Max Dynamic Range will often (but not always) choose the minimum gain value.
Once the sky background is measured and the limits and targets are set you can examine the results. In the image above, you can see that with a 5e/pixel/s sky brightness (quite bad light pollution), the calculation is recommending a gain value of 398, an exposure of 9.4s and a black level of zero (because the sky brightness will be enough to pull the histogram clear of the left hand side). The graphs below show useful detail on the calculations that help you understand the result and if necessary tweak the values.
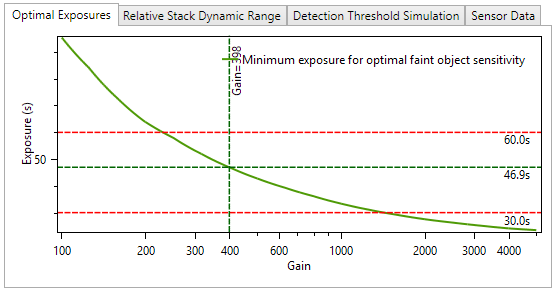
The optimal exposure chart shows you the exposure time you need to use to hit your ‘Read Noise Limit’ criteria for different gains – it also shows your minimum and maximum exposure limits as horizontal red lines if they fall within the range of the graph. From this graph we can see that in this case the recommended exposure is 46.9s at 398 gain, but an exposure of 60s could be used at 230 gain or 30s at about 1400 gain to get very similar results. You aim for at least the exposure time shown on this graph, although selecting a longer exposure won’t improve things much as we will see in the detection threshold simulation chart.
The relative stack dynamic range chart shows how the dynamic range of the final stacked image will be affected by changing the gain (assuming you follow the suggested exposure time for each gain value). This chart shows information for different bit depths if the required sensor analysis data is available. In this case the stack dynamic range for the 8 bit line drops to zero at gains below about 450. This happens when there are no valid solutions for the exposure time that fit all the limits you have chosen – for instance in this case a read noise limit of 10% would require exposures longer thant the maximum exposure value of 5 minutes when in 8 bit mode with a gain < 450. In this case (in common with many cameras), you can get a slight increase in the dynamic range of the final stacked image by moving to lower gain values.
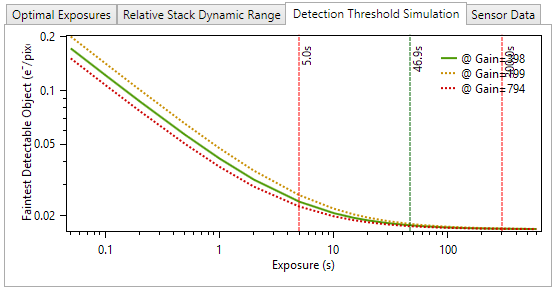
The third chart shows how the faintest visible object in the final stacked image varies with different exposure times. This chart makes it very clear how little extra you will achieve (other than pain in terms of guiding, tracking, hot pixels, satellite trails, aeroplane trails, etc) by exceeding the recommended exposure times. In this case at the recommended values, the expected faintest detectable object would be 0.0176 e/pixel/s. Increasing the exposure from ~47s to 300s drops that to 0.0168 e/pixel/s, an improvement of about 5%. You can also see that by this point the curves are basically flat – further increases in exposure bring practically no improvement to the final stacked image…
The Detection Threshold Simulation assumes that the faintest object you will be able to see in the final stacked image is equal in brightness to the noise level in that image. In fact, for objects that cover a large number of pixels, you might do a bit better than that as it is easier to see a large faint object than a small one, but this does not change the shape of the curve, in particular the fact that beyond the recommended exposure level there is practically no improvement in final image quality with further exposure increases.
In summary, when you use the Brain window, SharpCap simulates in a fraction of a second all the possible combinations of gain and exposure that you might use to image and calculates what the effect of each set of parameters would be on the final stacked image. This is possible because the results of the Sensor Analysis allow SharpCap to calculate the behaviour of the sensor for any combination of gain and exposure.
Smart Histogram requires a SharpCap Pro license and you must perform sensor analysis on each model of camera you intend to use. For best results perform sensor analysis in both 8 bit and high bit depth (12/14/16) modes.


